Page Speed for Local Service Sites: A Practical Guide
May 23, 202629 min read
Key Takeaways
1Most mobile users abandon a page that takes longer than 3 seconds to load - for local service businesses, every second of delay costs real phone calls and leads.
2Google uses Core Web Vitals (LCP, FID, CLS) as ranking signals for both organic results and local search, meaning site speed directly affects visibility in the map pack.
3Oversized images are the most common and easiest-to-fix speed problem on local service sites - compressing photos with free tools like Squoosh or TinyPNG can cut page size by 50 percent.
4Cheap shared hosting is often the hidden cause of slow Time to First Byte scores - upgrading to managed hosting can deliver more improvement than all other optimizations combined.
5Speed benchmarks worth targeting for a local service site include a mobile PageSpeed score above 70, LCP under 2.5 seconds, and total page size under 2MB.
6Service area pages and city-specific landing pages each need to be tested and optimized independently - a fast homepage does not guarantee fast subpages.
7When a WordPress site is heavily bloated with plugins and a slow theme, rebuilding on a purpose-built local business platform like Grow Local is often more cost-effective than repeated developer fixes.
8Speed is a trust signal - a fast, clean-loading site tells a first-time visitor the business is professional before they read a single word, increasing the likelihood they will make contact.
It is 9pm on a Tuesday, and a homeowner's basement is filling with water. She grabs her phone, searches "emergency plumber near me," and taps the first result. The page starts loading. A spinner appears. Five seconds pass. She taps the back button and calls the second result instead. That first plumber never knew she existed - and he never got the call.
This scene plays out thousands of times every day across every service category imaginable - roofing, HVAC, electrical, landscaping, pest control. The business with the slow website loses the customer before a single word is read. Page speed for local service sites is not a technical vanity metric. It is a direct line between a website visitor and a ringing phone.
Why Page Speed Matters More for Local Service Businesses
A major retail brand can afford a slow page. Customers will wait because they already trust the name. A local plumber, roofer, or HVAC company does not have that luxury. The visitor arriving at a local service website has an immediate need - a broken furnace, a leaking roof, a clogged drain - and almost no patience.
Local service website speed affects three things directly: whether a visitor stays, whether they call, and whether Google shows the site to the next person searching. All three matter in ways that compound over time. A high bounce rate tells Google the page is not satisfying search intent, which pushes rankings down, which reduces traffic, which reduces calls.
Page Load Time
Estimated Bounce Rate Increase
Impact on Local Service Leads
1-2 seconds
Baseline
Strong chance visitor calls or submits form
3 seconds
~32% increase
Noticeable drop in contact rate
5 seconds
~90% increase
Majority of visitors gone before reading anything
10+ seconds
~123% increase
Site is effectively invisible to mobile users in need
The Connection Between Load Time and Lost Phone Calls
Most mobile users abandon a page that takes longer than 3 seconds to load. That is not a guess - it is a number backed by years of mobile behavior research. For a local service business, every one of those abandoned visits is a potential phone call that never happened.
Consider a roofing company getting 50 searches a month for "roof repair" in their city. If their site loads in 6 seconds on mobile, research suggests they may be losing 40 or more of those visitors before the page even fully appears. At a typical close rate, that could mean 3-5 lost jobs every single month - just from page load time.
Mobile page speed and call conversions are directly tied. A visitor who sees a phone number fast is far more likely to tap it than one who waited 8 seconds and then had to scroll to find it. Load time shapes the entire first impression before a word is read.
How Google Uses Speed Signals in Local Search Rankings
Google introduced Core Web Vitals as official ranking signals in 2021. These are measurable, real-world speed metrics that reflect how fast a page actually feels to a real user - not just how fast it technically loads. They affect local SEO ranking directly.
For searches like "electrician near me" or "roof repair Springfield," Google is deciding which businesses to show in the map pack and organic results. A slow site with poor Google page experience scores is competing at a disadvantage against faster sites, even if everything else - reviews, citations, content - is equal.
Core Web Vitals do not automatically disqualify a site from ranking. But when two local businesses are otherwise close in quality signals, speed can be the tiebreaker. It is one of the few technical factors a local business owner can actually control and improve in a short amount of time.
Mobile vs. Desktop - Where Local Customers Actually Browse
More than 60 percent of local service searches happen on mobile devices, according to data from BrightLocal's local consumer research. For urgent service categories like plumbing and HVAC, that number is likely higher - someone dealing with a burst pipe is not walking to their desktop computer first.
Google's mobile-first indexing means it primarily uses the mobile version of a site to determine rankings. If a site scores 85 on desktop but 42 on mobile, Google is essentially treating it as a 42. The desktop score barely matters for how the site ranks in local mobile search behavior patterns.
Local mobile traffic is the audience that matters most for service area businesses. Fixing mobile speed is not just good practice - it is the single most direct lever available for improving both search visibility and the likelihood that visitors actually make contact.
How to Measure Your Site's Current Speed
Before fixing anything, a business owner needs to know where they actually stand. The good news is that the best website speed test tools are free and take about two minutes to use. The goal here is not to get a perfect score - it is to identify the biggest problems so effort goes to the right places first.
Start with Google PageSpeed Insights - it is free, official, and uses real-world data when available
Test both the mobile and desktop versions of the site separately
Test the homepage AND at least one service page - they often have different speeds
Screenshot or save the results before making any changes so progress can be measured
Look for the three Core Web Vitals scores, not just the overall number
Note which items show up in red or orange - those are the highest priority fixes
Using Google PageSpeed Insights to Get Your Score
Go to pagespeed.web.dev and paste in the website URL. Hit the Analyze button. Within about 30 seconds, a full performance audit appears with two tabs - Mobile and Desktop. Always check the Mobile tab first.
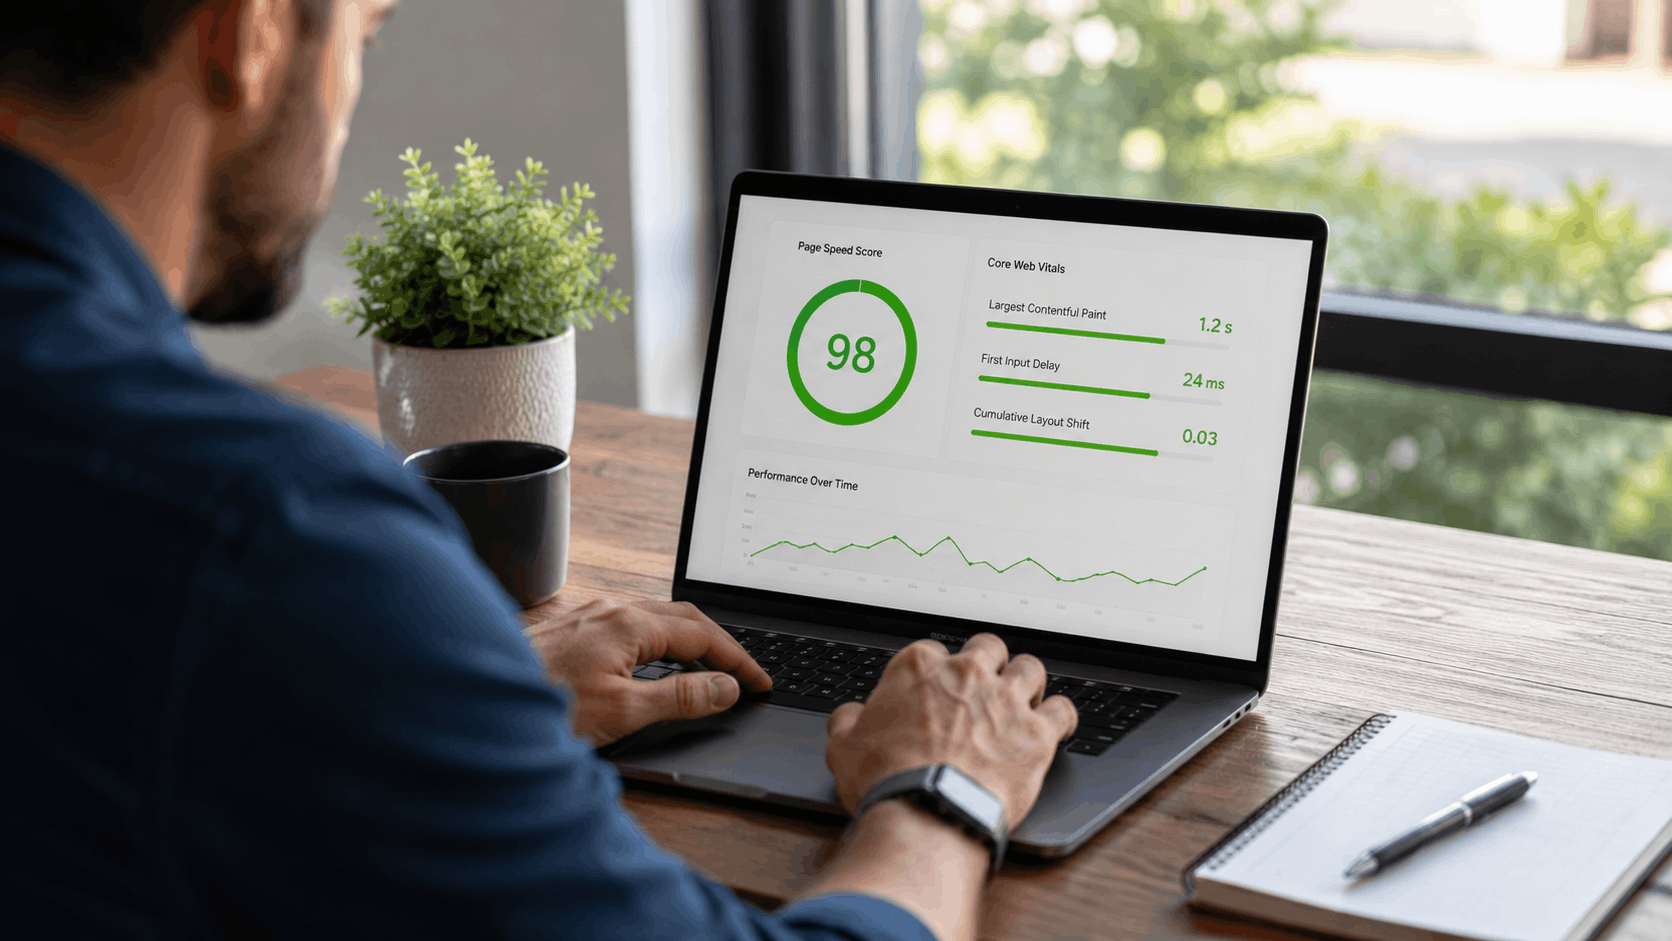
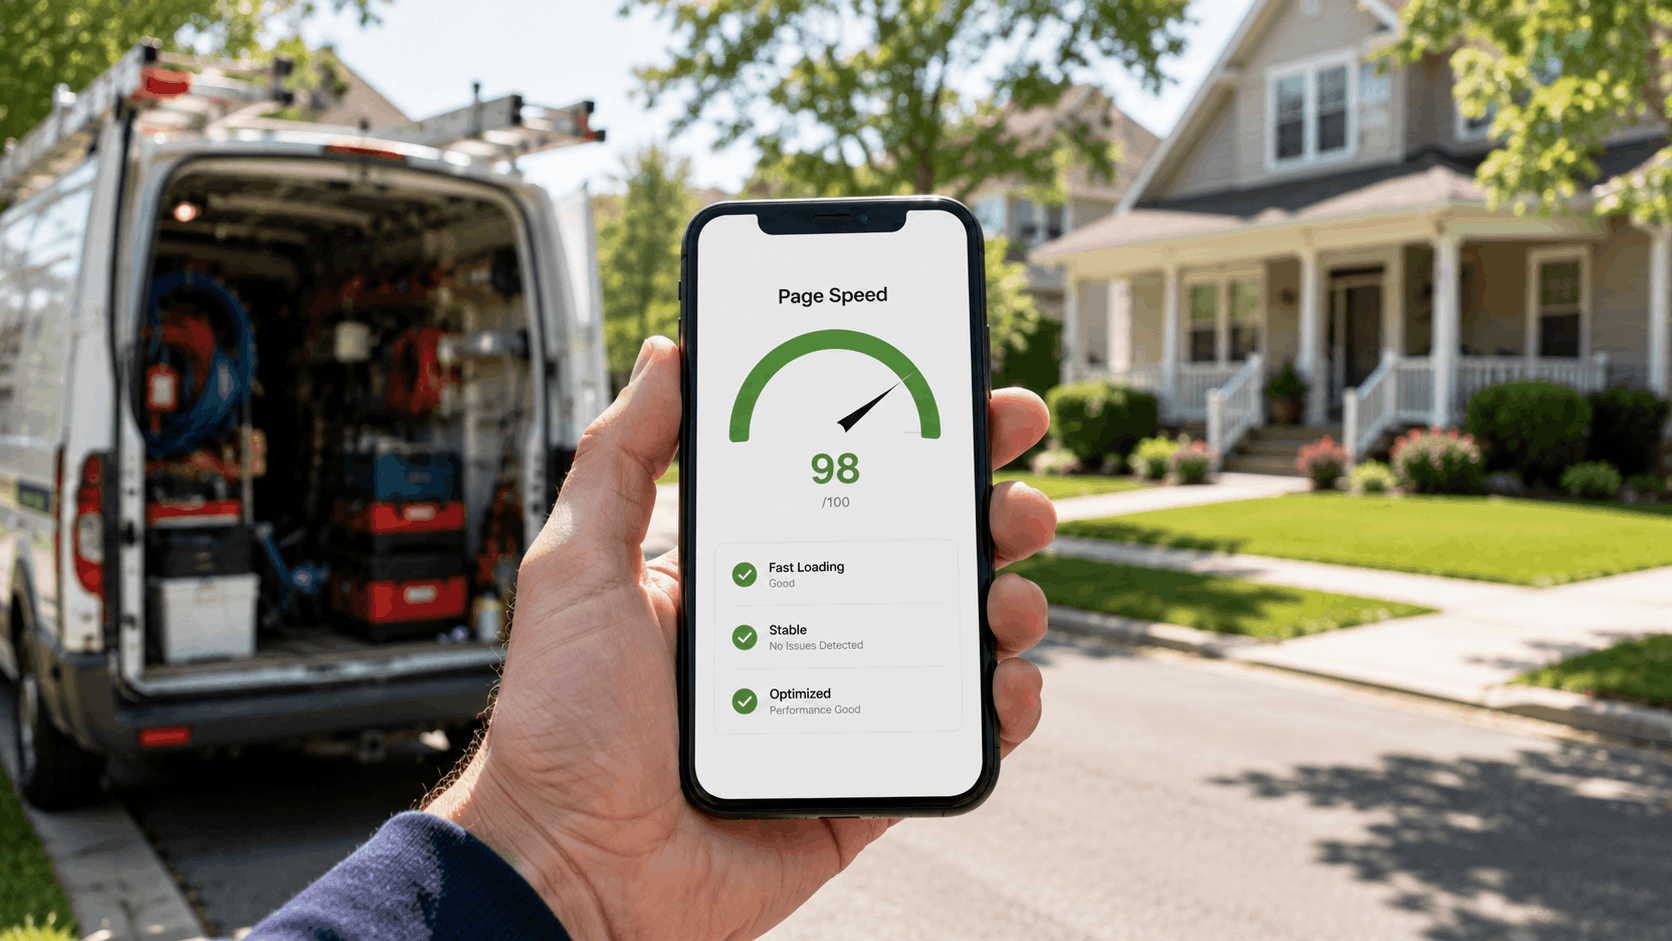
The score runs from 0 to 100. In the Lighthouse score system, 90 and above is green (good), 50-89 is orange (needs improvement), and below 50 is red (poor). For a local service site, a mobile PageSpeed Insights score of 70 or above is a reasonable working target. Anything below 50 on mobile is a real problem worth addressing quickly.
Below the score are four sections: Metrics, Opportunities, Diagnostics, and Passed Audits. The Opportunities section is the most useful - it lists specific changes and estimates how much load time each one would save. Start with the items showing the biggest estimated savings.
Reading Core Web Vitals - LCP, FID, and CLS Explained Simply
LCP stands for Largest Contentful Paint. Think of it as how long before a customer can actually read the phone number at the top of the page. If the big hero image or the main heading takes 6 seconds to appear, LCP is 6 seconds. Google wants LCP under 2.5 seconds.
FID stands for First Input Delay - how long before the page actually responds when someone taps a button or a link. A page can look loaded but still be frozen while scripts run in the background. CLS stands for Cumulative Layout Shift, which measures how much the page jumps around as it loads. If a customer goes to tap the phone number and the button moves down the screen mid-tap, that is CLS causing frustration.
All three FID Core Web Vitals show up in PageSpeed Insights with green, orange, or red labels. Green across the board is the target. Any red metric deserves attention before worrying about the overall score number.
Other Free Tools Worth Checking
GTmetrix is a strong alternative that gives a waterfall chart showing exactly which files load in what order and how long each takes. It is particularly useful for spotting a single large image or script that is holding everything else up. The free version allows a few tests per day and shows the same Core Web Vitals data.
WebPageTest offers even more detail and lets users test from specific geographic locations and device types. It is more technical than GTmetrix but useful when a business suspects their server response time is the issue. These website performance tools are worth a second look when PageSpeed Insights flags a problem but does not clearly explain the cause.
Running the same URL through two tools and comparing results gives a more complete picture. If both flag the same issue, it is almost certainly worth fixing. When results conflict significantly, trust the PageSpeed Insights score most - it is the one Google itself uses.
The Most Common Speed Problems on Local Service Sites
After reviewing hundreds of local service websites, the same slow website causes appear again and again. It is rarely one catastrophic problem - it is usually three or four medium-sized ones stacking on top of each other. A heavy image here, a bloated plugin there, cheap hosting underneath it all.
WordPress sites built with drag-and-drop page builders are particularly prone to these issues. They are easy to set up, which is why so many local businesses use them, but they accumulate weight over time as owners add plugins, photos, and widgets without realizing the cost.
Oversized Images - The Number One Culprit
A single photo taken on a modern smartphone and uploaded directly to a website can be 4-8 megabytes. A service site with a gallery of job photos, a hero image, team headshots, and a few before-and-after shots can easily push total page size past 15MB. That is not a website - it is a slide deck.
For image compression targets: hero images should land around 200-400KB in file size, and thumbnails should stay under 100KB. WebP format is about 25-30 percent smaller than JPEG at the same visual quality, making image file size reductions achievable without any visible difference to the customer.
Service sites with photo galleries are especially vulnerable because they grow over time. Every new project gets documented with full-resolution images, and no one goes back to compress the older ones. What starts as a fast site becomes a slow one gradually, without any single dramatic change.
Heavy Themes and Too Many Plugins
Many local service sites are built with WordPress themes from companies like Divi, Elementor, or WPBakery. These tools are flexible and popular, but each one loads a library of CSS and JavaScript files that the customer's browser has to download before anything appears on screen. Most of that code is never used on a given page.
Render-blocking resources are scripts that force the browser to pause rendering the visible page while it downloads and runs a file in the background. From the visitor's perspective, this looks like the page is frozen or blank. Adding a chat widget, a booking plugin, a reviews feed, and a popup plugin can stack up four or five render-blocking scripts on a single page.
WordPress plugins and page builder performance issues are fixable, but they require real technical work to untangle. Disabling plugins one at a time to test their speed impact is a useful diagnostic approach. Each disabled plugin that improves speed by half a second is one worth reconsidering.
Cheap Hosting and Shared Servers
Time to First Byte (TTFB) measures how long it takes for the server to begin responding after a browser makes a request. Before a single image or word can load, the server has to wake up and start talking. On a $4/month shared hosting plan with hundreds of other sites on the same server, that wake-up time can be 1-2 seconds by itself.
Web hosting speed is the foundation everything else sits on. Compressing images and removing plugins helps, but if the server takes 1.5 seconds just to respond, a sub-3-second total load time becomes almost impossible to achieve. A quality managed WordPress host typically costs $20-40/month and cuts TTFB to under 200 milliseconds.
Shared hosting is fine for a personal blog or hobby project. For a local business where every visitor represents potential revenue, it is the wrong tool. The difference in speed between a budget shared host and a quality managed host is often more dramatic than all other optimizations combined.
Practical Fixes Any Local Business Can Start With
Not every speed problem requires a developer. There are real, high-impact website speed fixes that a business owner or an office manager can apply in under an hour with free tools. These do not require touching code, logging into hosting panels, or understanding web servers.
The goal is to start with the changes that have the biggest impact for the least effort. Image optimization alone can cut page size by 50 percent or more on a typical local service site. That is often enough to move a score from the red zone into orange or even green.
Compressing and Resizing Images Before You Upload
The workflow is simple: before uploading any photo to the website, run it through a free image compression tool first. Squoosh (squoosh.app) is a browser-based tool from Google that lets users drag in an image, choose a quality level and format, and download a compressed version. No account needed, no software to install.
TinyPNG works similarly and is especially easy for people who are not comfortable with technical settings - just drag the image in and download the smaller version. For a practical approach: resize any photo to no wider than 1200 pixels before compressing, compress to under 200KB for most images, and save as WebP when the website platform supports it.
Applying this process retroactively to existing site photos takes a few hours but often produces the biggest single improvement. Start with the homepage hero image - it is usually the largest file on the most important page and fixing it alone can noticeably improve the improve page load time score.
Enabling Browser Caching and a Content Delivery Network
Browser caching tells a visitor's browser to save certain files - logos, stylesheets, fonts - so that on a second visit, those files do not have to download again. A returning visitor should see the site load significantly faster than a first-time visitor. Most WordPress caching plugins like W3 Total Cache or WP Super Cache can enable this in a few clicks.
A CDN (Content Delivery Network) stores copies of the site's files on servers around the world. When someone visits, they get files from the server closest to them rather than a single server in one data center. Cloudflare offers a free plan that works well for local service sites and is straightforward to set up with a domain name.
The combination of browser caching and a CDN can meaningfully reduce load times for all visitors, not just repeat ones. Both are free to implement at a basic level and neither requires touching website code directly.
Switching to Faster Hosting or a Speed-Focused Website Builder
At some point, chasing individual optimizations on a slow foundation stops making sense. If TTFB is above 600 milliseconds, no amount of image compression will get a site to load in under 2 seconds. That is when a hosting upgrade or platform switch becomes the right move.
For businesses on shared hosting, moving to a managed WordPress host like Kinsta, WP Engine, or SiteGround's higher tiers is a straightforward upgrade. For businesses whose current website is heavily bloated and outdated, the more practical path may be starting fresh on a platform built with speed as a baseline requirement.
Platforms built specifically for local service businesses - like Grow Local - are designed from the ground up with fast load times built in. There is no theme bloat to wrestle with, no conflicting plugins to audit. Speed is the starting point, not an afterthought applied later with fixes. For a local business website design that does not require a developer to keep fast, that matters a great deal.
Page Speed and Local SEO - How They Work Together
Site speed does not exist in isolation. It is one piece of a larger local SEO picture that includes Google Business Profile, local citations, on-page content, and reviews. A fast site amplifies all of that other work - a slow site undermines it.
Think of it this way: a business can have 200 five-star reviews and a perfectly filled-out Google Business Profile, but if the website it links to loads in 9 seconds, a significant portion of the people who click through will leave before forming any impression at all. The speed of the website affects the return on every other local SEO investment.
How a Fast Site Supports Your Google Business Profile
The Google Business Profile and the linked website are part of one connected experience in Google's view. When someone clicks the website link from a GBP listing and immediately bounces back to Google because the page is slow, that behavior is a signal. Over time, consistent bad experiences from GBP click-throughs can affect how Google evaluates the full local listing.
For local pack ranking, Google is trying to surface businesses that will give searchers a good experience. A fast site reinforces the message that this is a professional, reliable business worth sending traffic to. A slow site raises a quiet doubt in the other direction.
The business information on a local site - phone number, address, hours, service area - should load fast enough that a visitor can see it and act on it within the first two seconds. If it does not, the Google Business Profile is doing its job but the website is dropping the handoff.
Service Area Pages and Speed - Getting Both Right
Many local service businesses build separate pages for each city or neighborhood they serve - "plumber in Riverside," "HVAC repair in Moreno Valley," "roofing contractor in Temecula." This is a sound local SEO approach. But each of those pages needs to load fast independently, not just the homepage.
It is common for a homepage to score reasonably well because it has been cleaned up, while service area pages and city pages SEO suffer because they were built later and loaded with images, maps, and review widgets without the same attention. Google indexes and evaluates each URL separately.
For businesses using location-specific pages, the speed check should include at least one or two of those subpages in the audit. If the homepage scores 72 but every service page scores 45, the site has a real problem that homepage-only testing would miss entirely.
Speed as a Trust Signal for First-Time Visitors
A fast, clean-loading site tells a first-time visitor that the business is professional before they read a single review or see a single photo. It is similar to how a clean truck and organized tools signal competence when a contractor shows up to a job. The impression forms fast and it is hard to reverse.
Website trust signals like fast load times, clear contact information above the fold, and a layout that does not jump around all contribute to whether a visitor decides to call or leave. Conversion rate for local service businesses is not just about what is on the page - it is about whether the visitor stays long enough to see it.
First impression website experience is a real factor in whether a visitor becomes a lead. A slow site creates friction before the business has any chance to explain its value. Removing that friction is one of the most direct ways to turn more searchers into callers. The lead analytics data from a well-optimized site will reflect that improvement over time.
Speed Benchmarks to Aim For on a Local Service Site
Rather than chasing a perfect 100 score, local service businesses should aim for specific, realistic numbers that reflect what actually moves the needle on leads. A local plumber does not need the same performance as Google's homepage - but there is a floor worth clearing to avoid losing customers to speed alone.
The targets below are based on Google's published thresholds for Core Web Vitals and general industry consensus on what constitutes a competitive local service site. These are goals to work toward, not a pass/fail threshold that makes or breaks a business overnight.
Metric
Target for Local Service Site
Red Flag Threshold
Mobile PageSpeed Score
70 or above
Below 50
Desktop PageSpeed Score
85 or above
Below 65
LCP (Largest Contentful Paint)
Under 2.5 seconds
Over 4 seconds
FID (First Input Delay)
Under 100ms
Over 300ms
CLS (Cumulative Layout Shift)
Under 0.1
Over 0.25
Total Page Size
Under 2MB
Over 5MB
Time to First Byte
Under 400ms
Over 1 second
What a Good Score Actually Looks Like for a Service Business
A mobile PageSpeed score above 70, LCP under 2.5 seconds, and total page size under 2MB - those three numbers together indicate a site that will perform well for the vast majority of local mobile searchers. Hitting all three simultaneously is achievable without advanced technical work in most cases.
The LCP benchmark of 2.5 seconds is the most directly tied to real customer experience. It is roughly the point at which most mobile users make their decision to stay or leave. Getting LCP below that number should be the first priority for any local service site scoring poorly.
The mobile performance score target of 70 is realistic for a well-maintained local service site without a team of developers. Scores in the 80s and 90s are possible but require more effort and are more likely to slip when content is added over time. A consistent 70+ is more valuable than a one-time 90 that drops to 45 six months later.
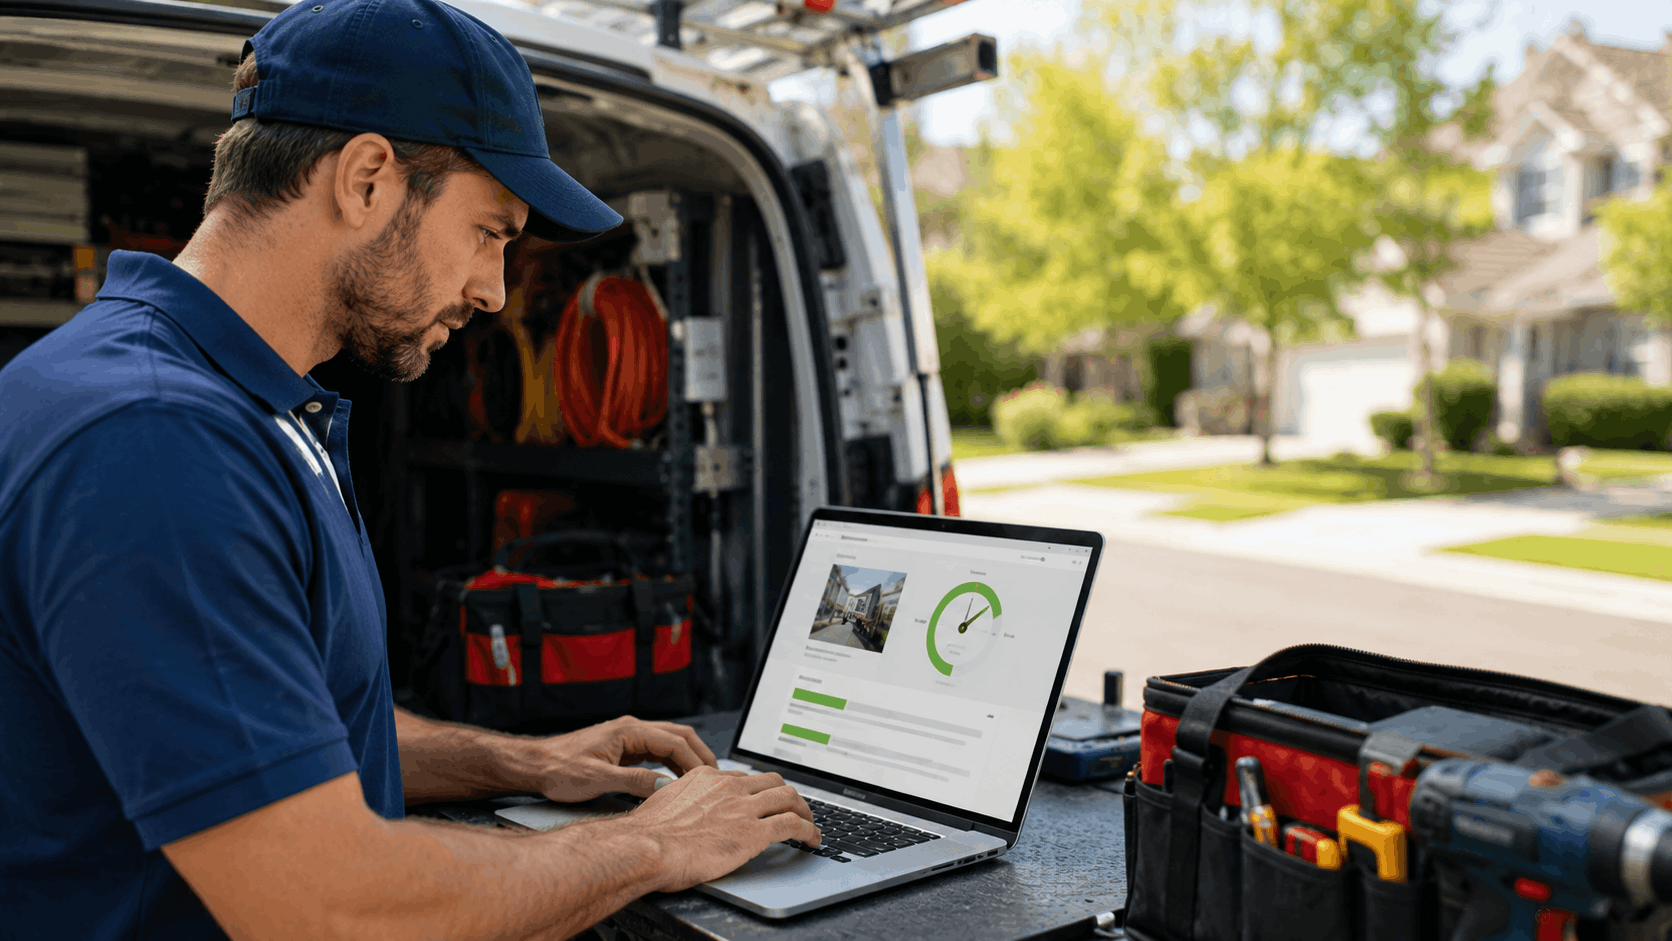
How Often to Re-Test and What Can Cause Scores to Drop
Website performance monitoring should happen at a minimum once per quarter. Testing after any significant change to the site - new pages added, a plugin installed, a photo gallery updated - is good practice because scores can slip fast after certain types of changes.
Common reasons for speed regression include: a new review widget that loads third-party scripts, a higher-resolution logo swapped in without compression, a video embed added to a service page, or a chat bot installed for customer inquiries. Each of these additions seems minor in isolation but they stack up.
Setting a recurring calendar reminder to run a speed audit every 90 days takes about 10 minutes and catches problems before they compound into a significant ranking or conversion issue. The site audit schedule does not have to be elaborate - the same PageSpeed Insights check used initially is all that is needed to track changes over time.
When to Hire Help vs. Fix It Yourself
Some speed problems are genuinely solvable in an afternoon with free tools and no technical background. Others are buried in server configuration files and require someone who works with this daily. Knowing the difference saves both money and time.
The decision usually comes down to three things: how severe is the problem, how much is the slow site costing in lost leads, and how complex is the fix. A site loading in 12 seconds with a score of 18 is a different situation than a site at 5 seconds with a score of 55.
Speed Problem
DIY or Hire Help?
Estimated Cost if Hiring
Oversized images
DIY - free tools available
$0
Basic caching plugin setup
DIY with plugin
$0 - $15/year
Hosting upgrade
DIY decision, setup may need help
$20 - $50/month
Removing unused CSS/JS
Hire a developer
$150 - $400 one-time
Database cleanup and optimization
Hire a developer
$100 - $300 one-time
Server configuration fixes
Hire a developer
$200 - $600 one-time
Full site rebuild on faster platform
Platform choice - DIY setup possible
Varies by platform
Speed Problems That Are Worth a One-Time Developer Fix
Certain issues are genuinely hard to fix without development knowledge. Removing unused CSS and JavaScript that a page builder left behind, cleaning up a WordPress database that has grown bloated over years, fixing server-level compression settings - these typically require someone comfortable in a terminal or a hosting control panel at minimum.
A developer speed audit runs roughly $300-600 depending on the complexity of the site. This typically includes a full review of what is causing slowdowns plus a list of prioritized fixes with effort estimates. Many developers will also implement the fixes as part of the same engagement for an additional $200-400.
For a local business spending $500/month on advertising and losing 30 percent of visitors to a slow site, a one-time $500 developer fix could pay for itself in the first month. The question is not whether the cost is worth it in absolute terms - it is whether the lead value justifies it.
When It Makes More Sense to Start Fresh on a Faster Platform
There is a point where an older, slow website costs more to repair than to replace. If a site was built five years ago on a heavy page builder theme, has 40 active plugins, is on shared hosting, and scores 22 on mobile - the fixes required to make that site genuinely fast could exceed $1,500 in developer time for a result that still requires ongoing maintenance.
Platforms built specifically for local service businesses handle the speed infrastructure from the start. Grow Local is built for exactly this scenario - a local business owner who needs a fast, local-SEO-friendly site without hiring a developer to maintain it. The site loads fast by default because the platform is not carrying the weight of a multipurpose tool trying to do everything for everyone.
For businesses comparing a costly repair job to a fresh start, the platform switch often wins on both cost and long-term simplicity. A simple management dashboard built for local business owners means no developer dependency for future updates either.
Real-World Examples - Before and After Speed Improvements
Abstract numbers are useful, but seeing how page speed improvements translate into real business outcomes makes the case much more clearly. The following examples are illustrative scenarios based on patterns seen across local service sites - the types of results that are realistic when specific fixes are applied consistently.
Neither example involves a major technical overhaul done by a large agency. Both reflect the kind of targeted work a small business can accomplish with the right priorities and either a few hours of their own time or a modest developer budget.
A Roofing Company That Dropped Load Time From 9 Seconds to Under 2
A residential roofing company in a mid-size market had built a WordPress site with a heavy visual theme, a large photo gallery of completed jobs, and several third-party plugins including a chat widget, a review aggregator feed, and a booking tool. The site loaded in 9 seconds on mobile and had a PageSpeed score of 24.
Three specific fixes were applied: all job photos were compressed using Squoosh and resized to under 1200 pixels wide, the chat and booking plugins were removed in favor of a simple phone number button, and the site was moved from shared hosting to a managed WordPress host. Total cost was about $35/month more in hosting, and three hours of image work.
The result was a mobile load time of 1.8 seconds and a PageSpeed score of 76. Over the following 60 days, the roofing website speed improvement correlated with a measurable increase in contact form submissions and a drop in bounce rate from 74 percent to 41 percent. More visitors were staying long enough to call.
A Landscaping Business That Stopped Losing Mobile Visitors
A landscaping business had a beautiful site with large hero images, a seasonal gallery, and a quote request form. On desktop it looked sharp. On mobile, the images were served at full size, the gallery loaded 18 uncompressed photos, and the layout shifted as ad scripts loaded below the fold. Mobile bounce rate sat at 81 percent.
The owner switched to a platform built for local service businesses, migrated their content with compressed images, and kept only the services, contact information, and lead form as the primary page elements. Within a week, mobile bounce rate dropped to 47 percent and the landscaping website began receiving 3-5 new quote request form submissions per week compared to nearly none before.
The lesson from both cases is consistent: lead form conversions improve when speed reduces the friction between a visitor arriving and a visitor contacting the business. Speed does not replace good service or good reviews - but it stops good potential customers from leaving before they ever get the chance to see either.
Final Thoughts
Page speed is one of the few things a local service business can control directly that affects both Google rankings and whether visitors actually turn into customers. It is not a one-time fix - it is an ongoing part of running a professional online presence.
The businesses that win local search are not always the ones with the biggest budgets or the most reviews. Often they are the ones whose sites load fast enough that frustrated, urgent customers actually stay long enough to call. That is a low bar to clear, but a surprising number of local competitors are failing it.
Start with the tools mentioned in this guide, identify the biggest issues on the current site, and tackle them one at a time. For businesses at the point where the site itself is the problem rather than individual elements within it, Grow Local offers a faster path to a site that works from the start. See what is possible at growlocal.build.
Frequently Asked Questions
How fast should a local service website load?
The target is under 3 seconds on mobile, with under 2 seconds being the stronger goal. Research consistently shows that the majority of mobile users abandon a page after 3 seconds. For local service businesses where visitors have an immediate, urgent need - a plumbing emergency, a roof leak, an HVAC failure - every extra second of load time is a direct reduction in the likelihood that visitor picks up the phone.
Does page speed directly affect Google rankings for local businesses?
Yes. Google officially uses Core Web Vitals and page experience signals as ranking factors. This affects both organic search results and the broader evaluation of sites linked from local listings. While speed is one factor among many, it is one of the few technical factors a local business can meaningfully improve without a large budget. Businesses with similar review counts and content quality are often separated in rankings by their site performance scores.
What is the easiest thing a business owner can do today to speed up their site?
Compress the homepage hero image. Go to squoosh.app, drag in the large photo currently sitting at the top of the homepage, resize it to no wider than 1200 pixels, compress it to under 200KB, save as WebP, and re-upload it to the site. This one change often reduces total page weight by 30-50 percent on image-heavy local service sites and can be completed in under five minutes with no technical knowledge required.
Why does my site score differently on mobile versus desktop?
Google tests both separately because mobile devices have less processing power than computers and are often running on slower cellular connections. A desktop browser can handle heavier scripts and images without noticeable delay, while a mobile browser may spend 2-3 seconds just parsing the same JavaScript. The mobile score carries more weight in Google's ranking decisions due to mobile-first indexing, which means most sites should prioritize improving their mobile PageSpeed Insights result above all else.
How much does it cost to fix a slow website?
It depends entirely on the source of the problem. Compressing images and installing a caching plugin costs nothing but an hour of time. Moving to better hosting typically adds $15-30 per month. A developer audit and targeted cleanup usually runs $300-$1,000 depending on the complexity of the site. A full rebuild on a faster, purpose-built platform for local businesses varies by provider but is often more cost-effective long-term than repeated developer fixes on an aging site.
Will a faster website actually get me more calls and leads?
Speed alone does not guarantee more leads, but a slow site actively blocks them. A visitor who leaves after 4 seconds never sees the phone number, never reads the reviews, and never fills out the form. Reducing load time keeps more visitors on the page long enough to make contact. In realistic scenarios, dropping from a 9-second load time to under 2 seconds can reduce bounce rate by 30-40 percentage points, which translates directly into more people reaching the contact information.
What are Core Web Vitals and do I need to worry about them?
Core Web Vitals are three specific speed measurements Google uses as ranking signals. LCP measures how long before the main content appears on screen. FID measures how quickly the page responds when a visitor taps something. CLS measures how much the page layout shifts around as it loads. Local businesses should pay attention to these because Google uses them when deciding rankings - and the thresholds Google has set (LCP under 2.5s, FID under 100ms, CLS under 0.1) are achievable targets for any well-maintained service site.
Does the platform I build my site on affect page speed?
The platform choice is one of the biggest speed factors of all. A WordPress site with a heavyweight theme and 30 plugins starts with a much larger performance burden than a purpose-built local business platform. Grow Local's features are built around the needs of local service businesses, with fast load times baked into the platform itself - not added later through plugins. The starting point is fast, which means less maintenance required to stay fast over time.
How often should I check my site speed?
Check site speed after any significant change to the site and at minimum once every three months. Changes that commonly cause speed to slip include uploading new photos without compression, installing a new review widget or chat tool, adding a video embed to a service page, or updating a plugin that loads additional scripts. A quarterly speed check using PageSpeed Insights takes about 10 minutes and catches problems before they affect rankings or lead volume.
Can a slow website hurt my Google Business Profile performance?
The Google Business Profile itself is separate from the website, but the two are part of one connected search experience. When someone clicks the website link from a local listing and immediately bounces back to Google because the page loaded too slowly, that behavior creates a negative signal around the full local presence. A slow site reduces the return on the effort put into building a strong GBP, because visitors who click through and leave never become leads regardless of how good the profile looks.
Written by Grow Local Team
Editorial
Grow Local helps local service businesses build SEO-ready sites and grow online.